Our Mission…
Is to build a deep understanding of energy and climate through education, inspiring and empowering people to take action for increased sustainability in our communities, economy and environment.
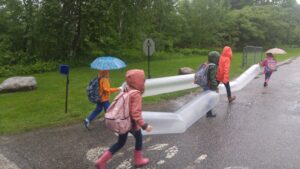
 Bring hands-on equipment to your classroom or community space.


We help Vermont and New Hampshire students, teachers, and school communities build a deep understanding of energy and climate with interactive workshops, equipment, and action programs.
Featured Stories
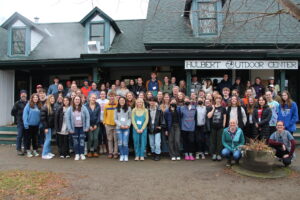
- High school students learn new skills, build connections, and leave feeling empowered at YCLA
- Apply for Small Grants Now!
- Teacher Jesslyn Mullett Discusses How She Incorporates Climate Action into Her Curriculum